Why Plant-Specific Spectral Tuning Matters
Different plant species — and even different cultivars — rely on distinct combinations of photoreceptors to regulate photosynthesis, morphology, flowering, stress responses, and metabolic activity. Because each photoreceptor has its own spectral absorption profile, the quality of light (its wavelength composition) is just as critical as the quantity.
Conventional greenhouse lighting assessments often compress the spectrum into single aggregated values (e.g., PAR or lux), which fail to reveal the wavelength-specific information that actually governs plant physiology.
High-resolution spectroradiometric assessment preserves the full spectral power distribution (SPD), enabling precise analysis and optimisation of light environments for specific crops.
Plant-Specific Spectral Responses and the Importance of High-Resolution Light Measurement
1. Chlorophyll Absorption Profiles and Species-Specific Photosynthetic Efficiency
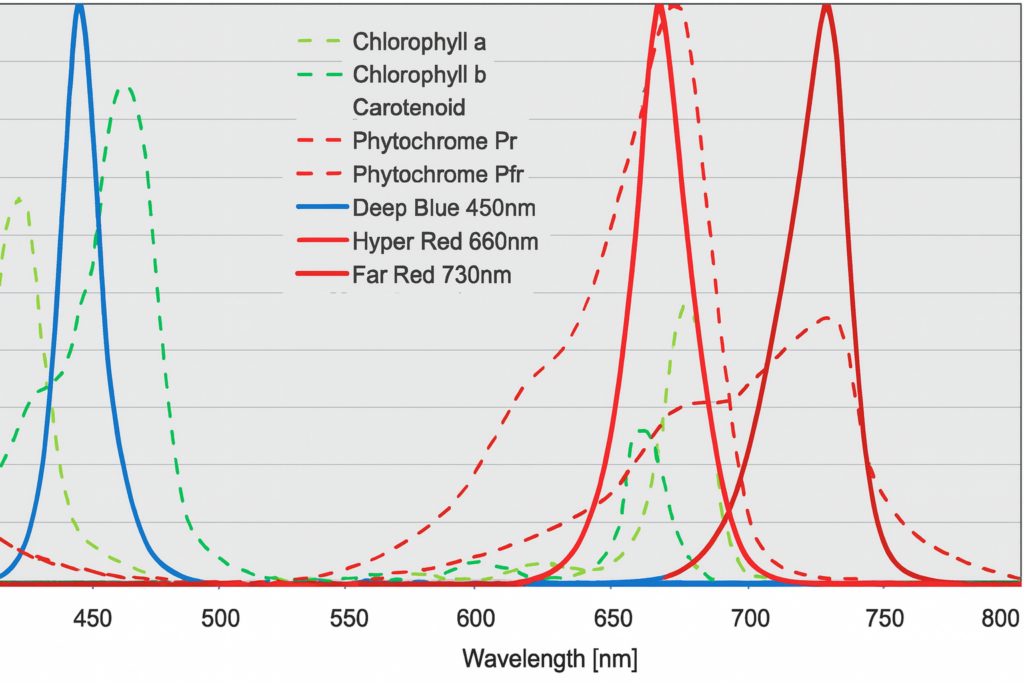
Chlorophyll a and b absorb strongly in the blue (≈430–470 nm) and red (≈620–670 nm) regions of the spectrum. However, plant species differ in chlorophyll ratios, canopy architecture, and leaf optical properties, resulting in distinct spectral responses.
Shade-tolerant crops (e.g., lettuce, spinach) typically exhibit higher chlorophyll b content and respond more effectively to slightly green-shifted spectra. In contrast, high-light crops (e.g., tomatoes, peppers) benefit from red- and far-red-enriched environments that support higher photosynthetic rates and improved light penetration through dense canopies.
Resolving the full wavelength distribution allows direct assessment of how well a given light spectrum aligns with the intrinsic pigment composition of a crop, rather than relying on aggregated intensity metrics.
2. Phytochrome-Mediated Regulation of Plant Architecture
The phytochrome system exists in two interconvertible forms:
-
Pr, which absorbs red light (≈660 nm)
-
Pfr, which absorbs far-red light (≈730 nm)
The red:far-red (R:FR) ratio governs a wide range of developmental processes, including:
-
stem elongation
-
leaf expansion
-
shade-avoidance responses
-
flowering initiation
-
biomass allocation between vegetative and reproductive tissues
Crop requirements for R:FR balance vary significantly. Leafy greens generally require reduced far-red exposure to maintain compact morphology, while fruiting crops may benefit from increased far-red to enhance flowering and fruit set.
High-resolution spectral data enables accurate quantification of R:FR distributions and interpretation of their physiological consequences.
3. Blue-Light Photoreceptors: Morphology, Gas Exchange, and Metabolite Synthesis
Blue light activates cryptochromes and phototropins, influencing:
-
stomatal conductance
-
leaf thickness and cuticle development
-
root-to-shoot allocation
-
stress signalling pathways
-
synthesis of secondary metabolites (e.g., flavonoids, terpenoids)
Optimal blue-light levels are highly species- and stage-dependent. Fine spectral resolution allows narrow-band blue contributions to be assessed directly, rather than approximated through broadband measurements.
4. Carotenoid Absorption and Stress Acclimation
Carotenoids absorb primarily in the 400–500 nm range and play a critical role in:
-
photoprotection
-
heat dissipation
-
prevention of photoinhibition
-
stabilisation of the photosynthetic apparatus under fluctuating conditions
Because carotenoid dynamics differ across species, detailed spectral measurements in the blue–green region provide insight into how a light environment influences stress tolerance, resilience, and energy-dissipation mechanisms.
5. Species-Specific Spectral Fingerprints
Each plant species interacts with light through a unique combination of:
-
pigment composition
-
photoreceptor densities
-
leaf and canopy structure
-
wavelength-dependent developmental triggers
-
metabolically sensitive photon energies
Examples include:
-
Basil, which exhibits strong blue-enhanced responses linked to essential-oil production
-
Strawberries, which require precise far-red control to balance yield and compact growth
-
Lettuce, which performs optimally under cooler spectra with moderated red light
-
Cannabis, which responds strongly to shifts in the 660/730 nm phytochrome balance during flowering
Characterising the precise spectral distribution enables the design of species-specific lighting strategies aligned with physiological requirements.
6. Scientific Advantages of High-Resolution Spectral Analysis
Full spectral power distributions measured at fine resolution enable:
-
identification of spectral gaps limiting photosynthetic efficiency
-
accurate quantification of red–far-red dynamics
-
evaluation of blue-light contributions to morphology and metabolite synthesis
-
assessment of spectral uniformity across the greenhouse canopy
-
prediction of physiological outcomes using established photobiological models
-
data-driven tuning of artificial lighting systems by crop and growth stage
Unlike PAR meters, lux sensors, or RGB-based devices, high-resolution spectroradiometric measurements:
-
do not average or compress wavebands
-
preserve physiologically critical narrow spectral features
-
distinguish spectra with identical PAR but different biological effects
-
provide actionable, biologically meaningful data
This approach moves greenhouse lighting evaluation beyond crude intensity metrics, enabling precise optimisation of spectral environments tailored to individual plant species.